
QGIS vs Python Workflow from a New Grad Student
This year, I got accepted by the Faculty of Forestry at UBC and was lucky to work in the remote sensing lab as a master’s student. I had some experience with geoprocessing in Python before but still needed help choosing the right tool for GIS tasks. My main question was whether I should invest time in learning popular geographical systems such as QGIS. And if so, to what extent should I use it instead of Python?
After a month of experiments, I finally figured out a workflow that combines the best of both worlds. This article is intended for students or programmers new to GIS who need to iterate on things quickly. You will hear about what QGIS is good at/less suited for from a programmer’s perspective. Of course, there are other commercial tools, but QGIS is both powerful and free.
What QGIS is good at
You might have heard of QGIS and thought it was designed for people who cannot code. While that might be true, its consistent interface and multi-functional toolbox make it easy for newbies to see GIS in action. Everyday processing tasks such as clipping, adding new geometry attributes, or raster calculation are rooted inside QGIS. Most importantly, it allows an instant view of any processed layers or maps; visualization is critical in any data science work.
There are plenty of YouTube videos or documentation that explain how to use a specific function in QGIS. Instead, I will use an example from my project to illustrate the usefulness of the software. The example is about post-processing a segmentation map to generate basic statistics.
Post-processing
I have obtained a region map from a segmentation algorithm in a raster format. By loading it into QGIS, we can see different shades represent different region IDs.

The first thing is to convert the file into vector format to work on summary data on the polygon level.
We go to Raster -> Conversion -> Polygonize (Raster to Vector).
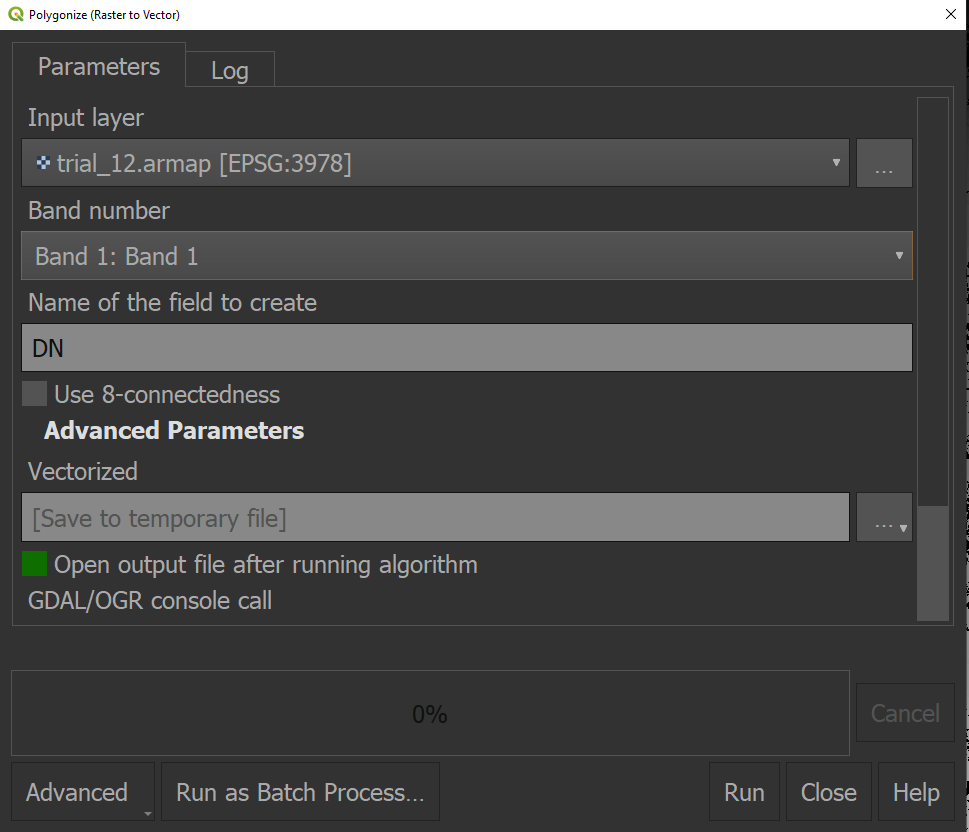
When we click anywhere in the vector file, there is one attribute called DN, which represents a unique region ID for that polygon. However, our end goal is to plot the histogram and show basic statistics for the area size; this requires us to add the area for each geometry.
We go to Vector -> Geometry Tools -> Add Geometry Attributes.
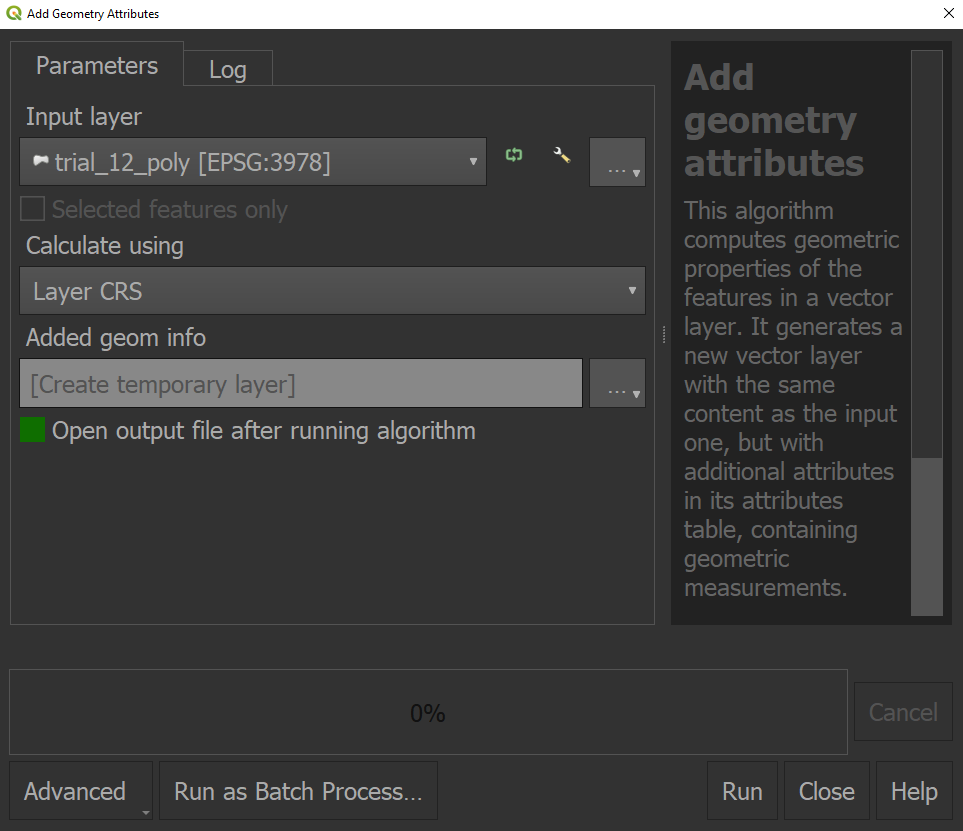
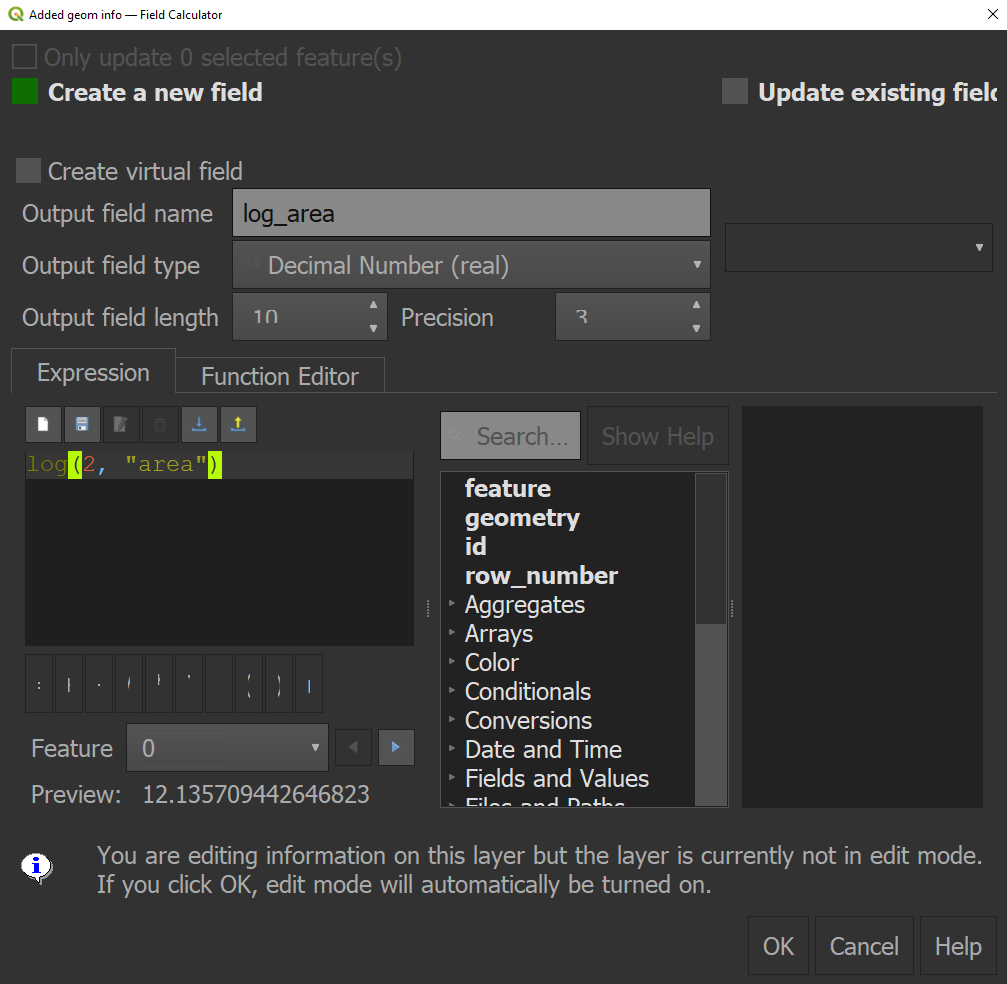
The unit for the area is in $m^2$. We will add a new attribute for the logarithmic scale to avoid a few larger values making the skewed histogram.
Right-click the layer in the Layers panel and go to Open Attribute Table. From there, we click the Open Field Calculator.
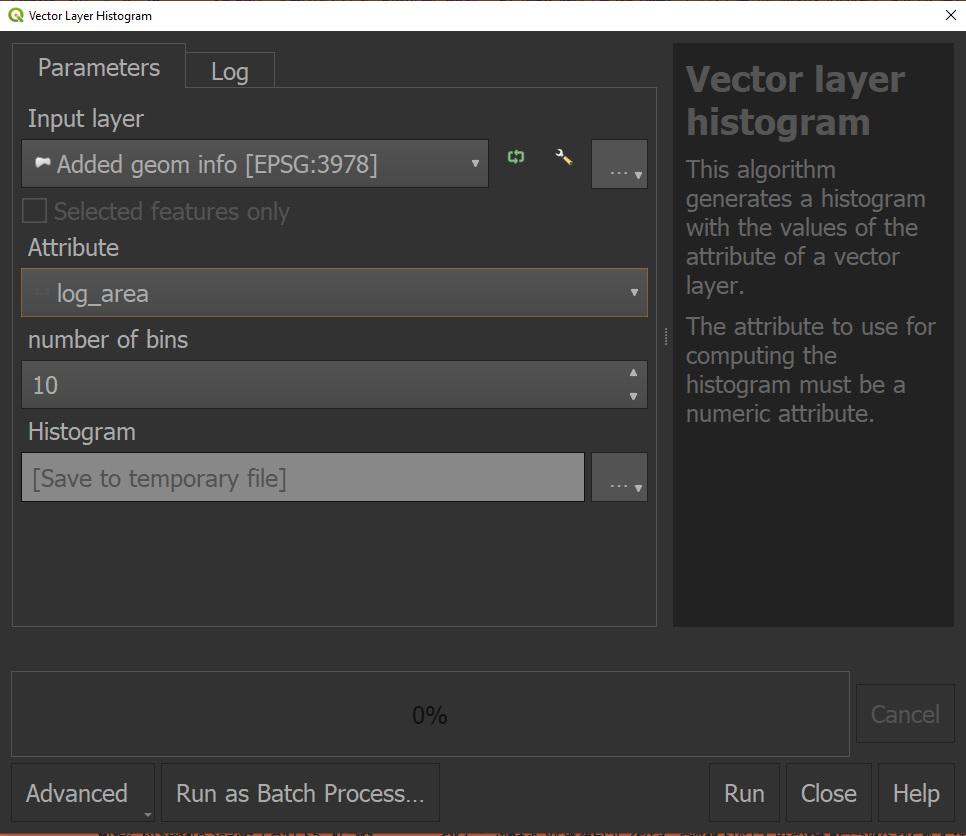
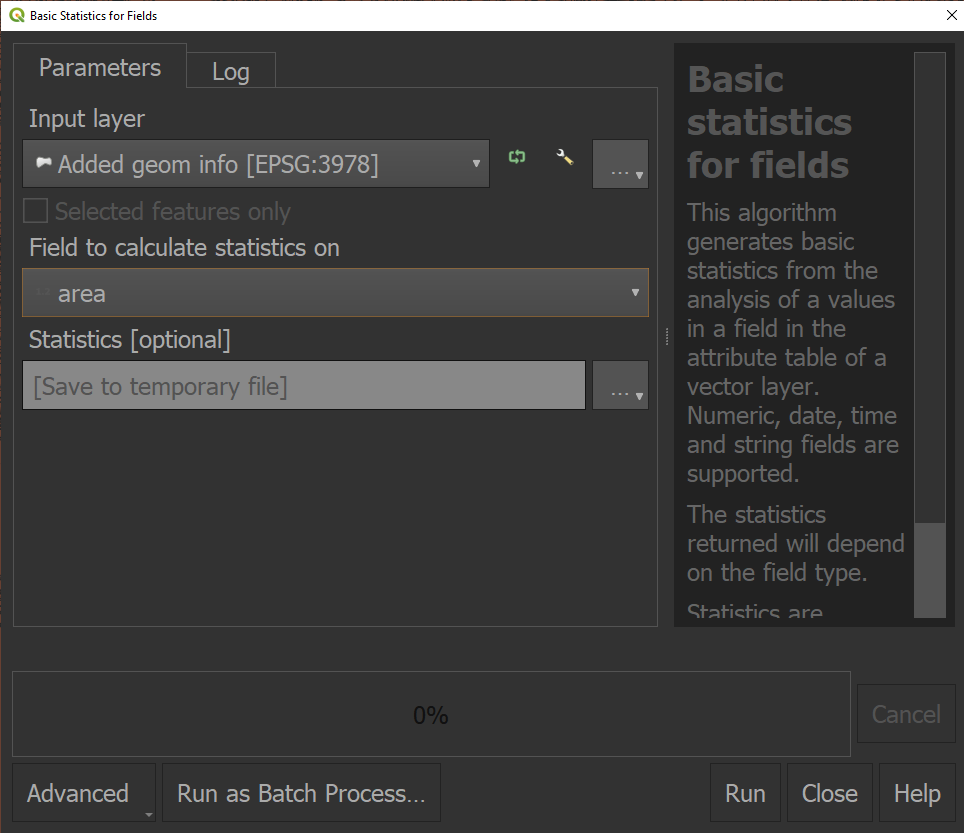
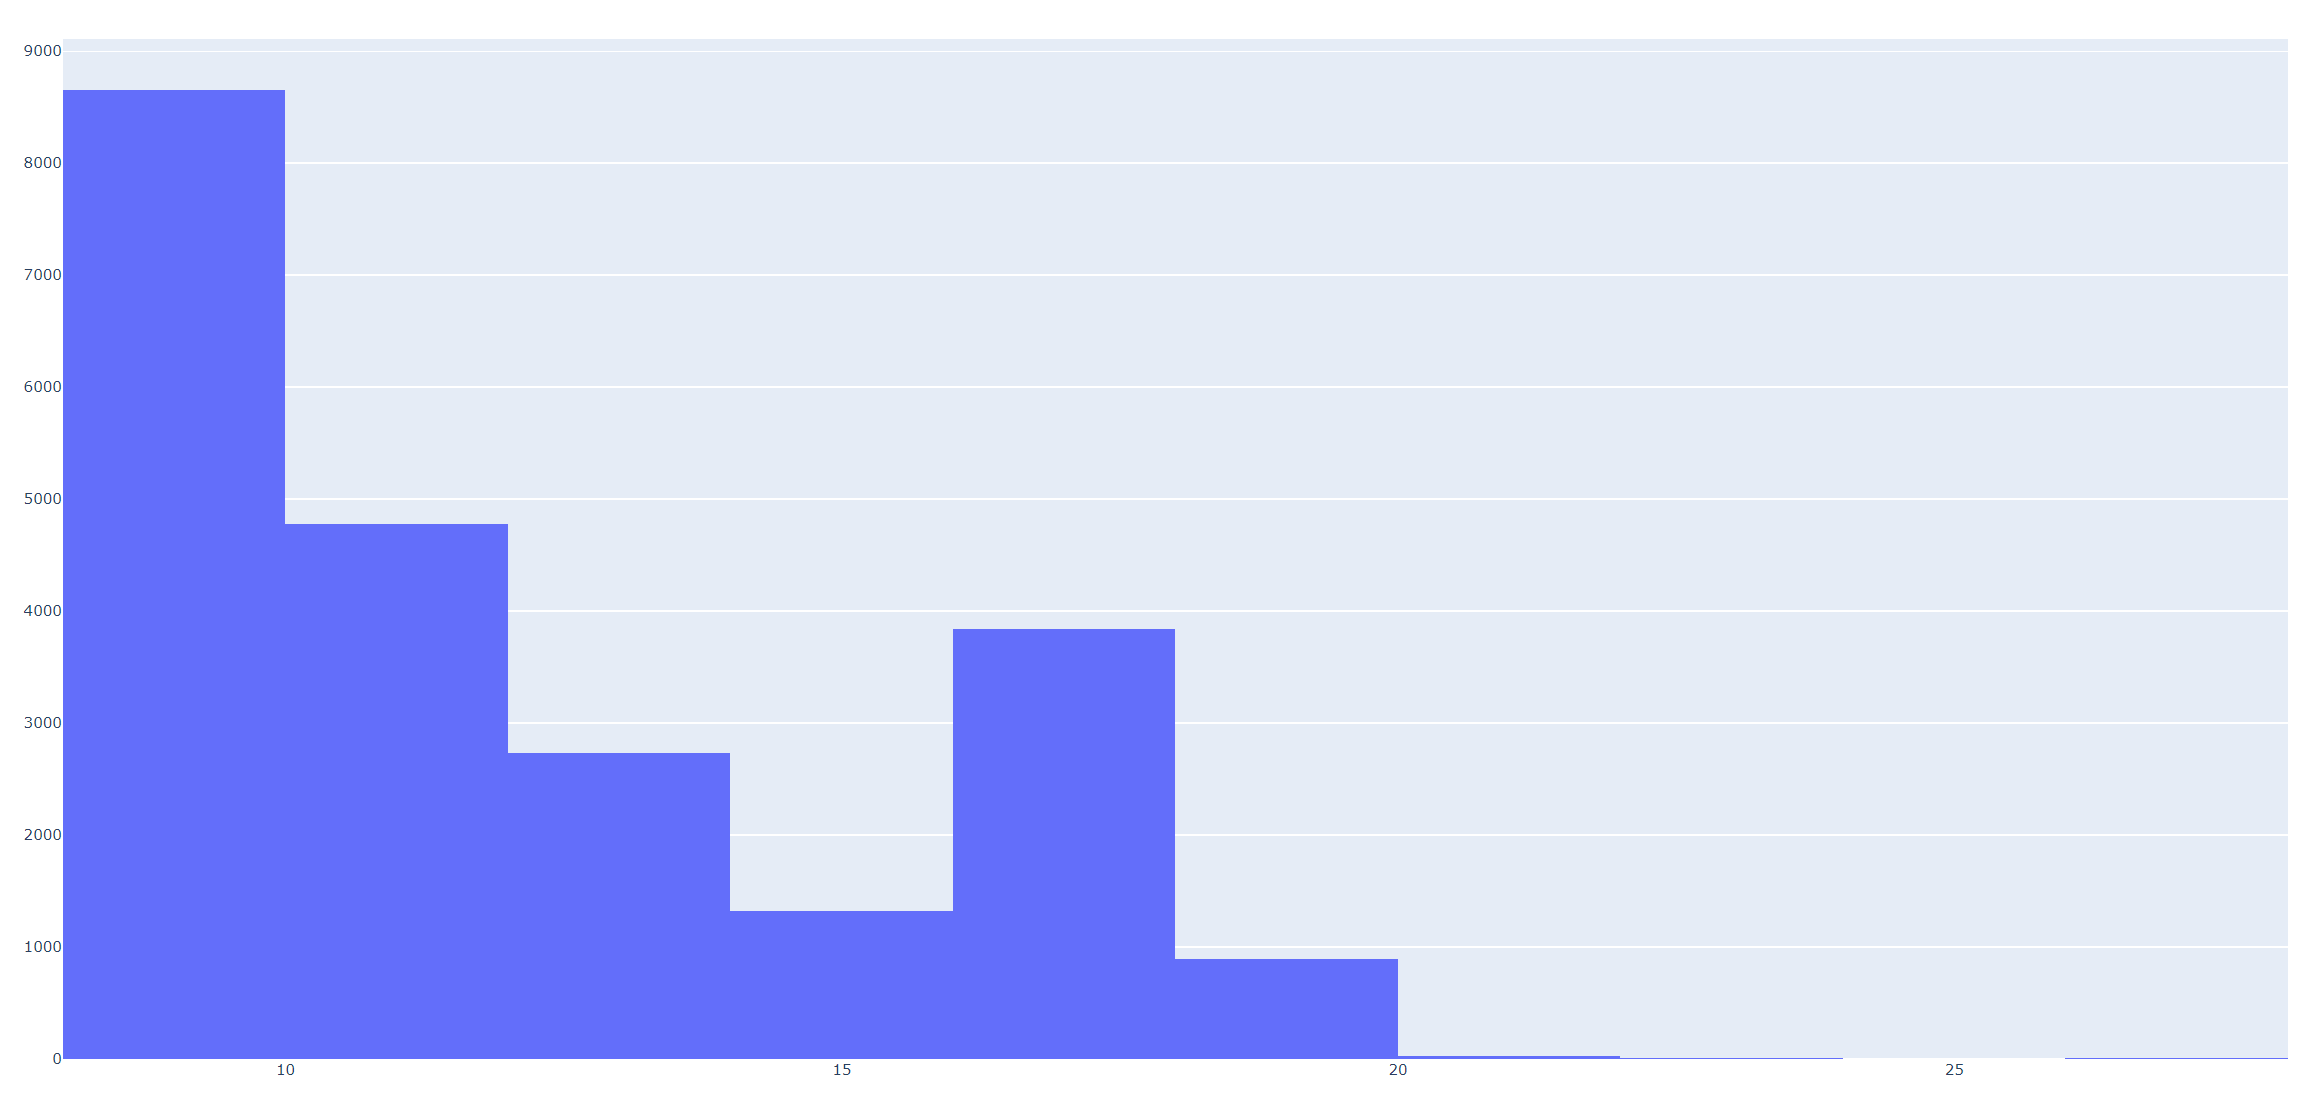
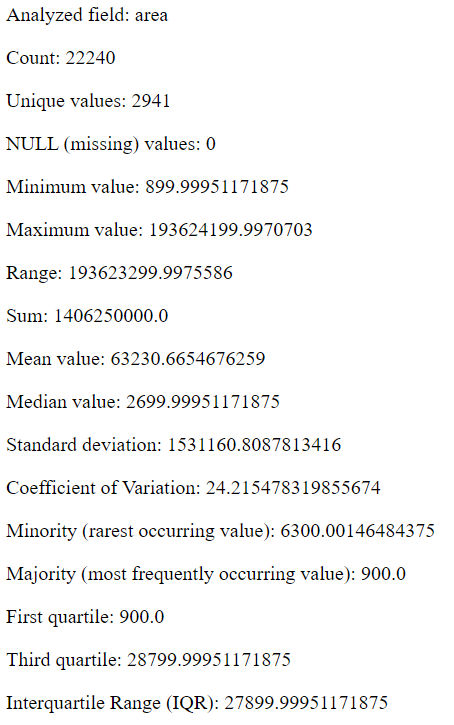
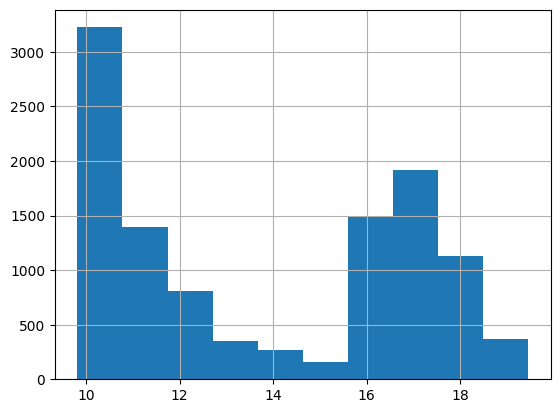
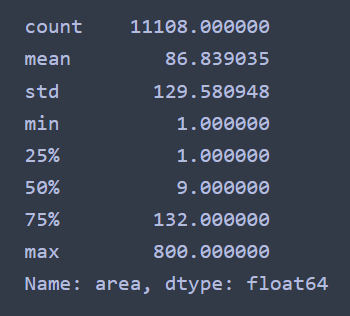
Lastly, we need to display the histogram for log_area and calculate the mean, median, maximum, and minimum values for the area.
For the histogram, go to Processing -> Toolbox and search for Vector layer histogram.
For statistics, go to Toolbox again and search Basic statistics for fields.
Outputs are as follows.
After the above steps, I can finally compare my segmentation results with the ground truth.
What QGIS is less good at
After the initial exploration, the benefits of clicking around in QGIS diminish as we need to repeat the same process for every experiment. Automation has become our new priority. QGIS does provide a Python environment for programmers to automate tasks; however, their custom library APIs are challenging to learn. On the other hand, almost all the standard operations can be found in either GeoPandas or Rasterio for a Python user. For example, the above post-processing steps can be realized in the GDAL command line and Geopandas.
# outfile is the generated region map in raster format

gdal_polygonize.py -b 1 -f "ESRI Shapefile" ${outfile} ./results/"${oname}_poly.shp"
After getting the vector file, we run through the following code to output the histogram and statistics.
DIR = "./results/"
TRIAL = 12
region_file = "trial_{}_poly.shp".format(TRIAL)
shp_in = gpd.read_file(DIR+region_file)

valid_poly = shp_in[shp_in["DN"] > 0]
valid_poly["area"] = valid_poly["geometry"].area
valid_poly["log_area"] = np.log2(valid_poly["area"])

valid_poly["log_area"].hist()
(valid_poly['area'] / 900).describe()
For some, the QGIS Python console is valuable partly because one can instantly view its output in the graphic panel, But for me, Matplotlib is more than enough.
Conclusion
Hopefully, I have convinced you to incorporate QGIS’s features in your work, especially for GIS newbies. It is fantastic software written by coders who know the ins and outs of geoprocessing. The visualization gives a clear signal of whether you have done something incorrectly. Finally, you can automate all the manual work by turning it into code.
I hope you enjoy the blog post so far, and I am keen to hear about your experience in this self-learning journey.